Quickstart Checklist
Follow this guided workflow immediately after the first boot to confirm each lab is online. All steps assume the documentation and the LinkPeek UI run on the same release.
Start on the dashboard and confirm the tunnel, labs, and export tiles report a healthy state before proceeding.
Interpret activity signals
Section titled “Interpret activity signals”LinkPeek highlights who touched your endpoints directly on the home dashboard. Use the source badges to prioritise follow-up:
- Real-User Click Confirms that a human trigger succeeded through the public tunnel.
- Real-User Preview Indicates a rich preview render from a messaging or social client.
- PreviewBot Captures crawler traffic (e.g. Slackbot, Discord); verify fallback payloads if previews fail.
- Scanner Shows automation hits from LinkPeek’s scanner jobs or external monitors.
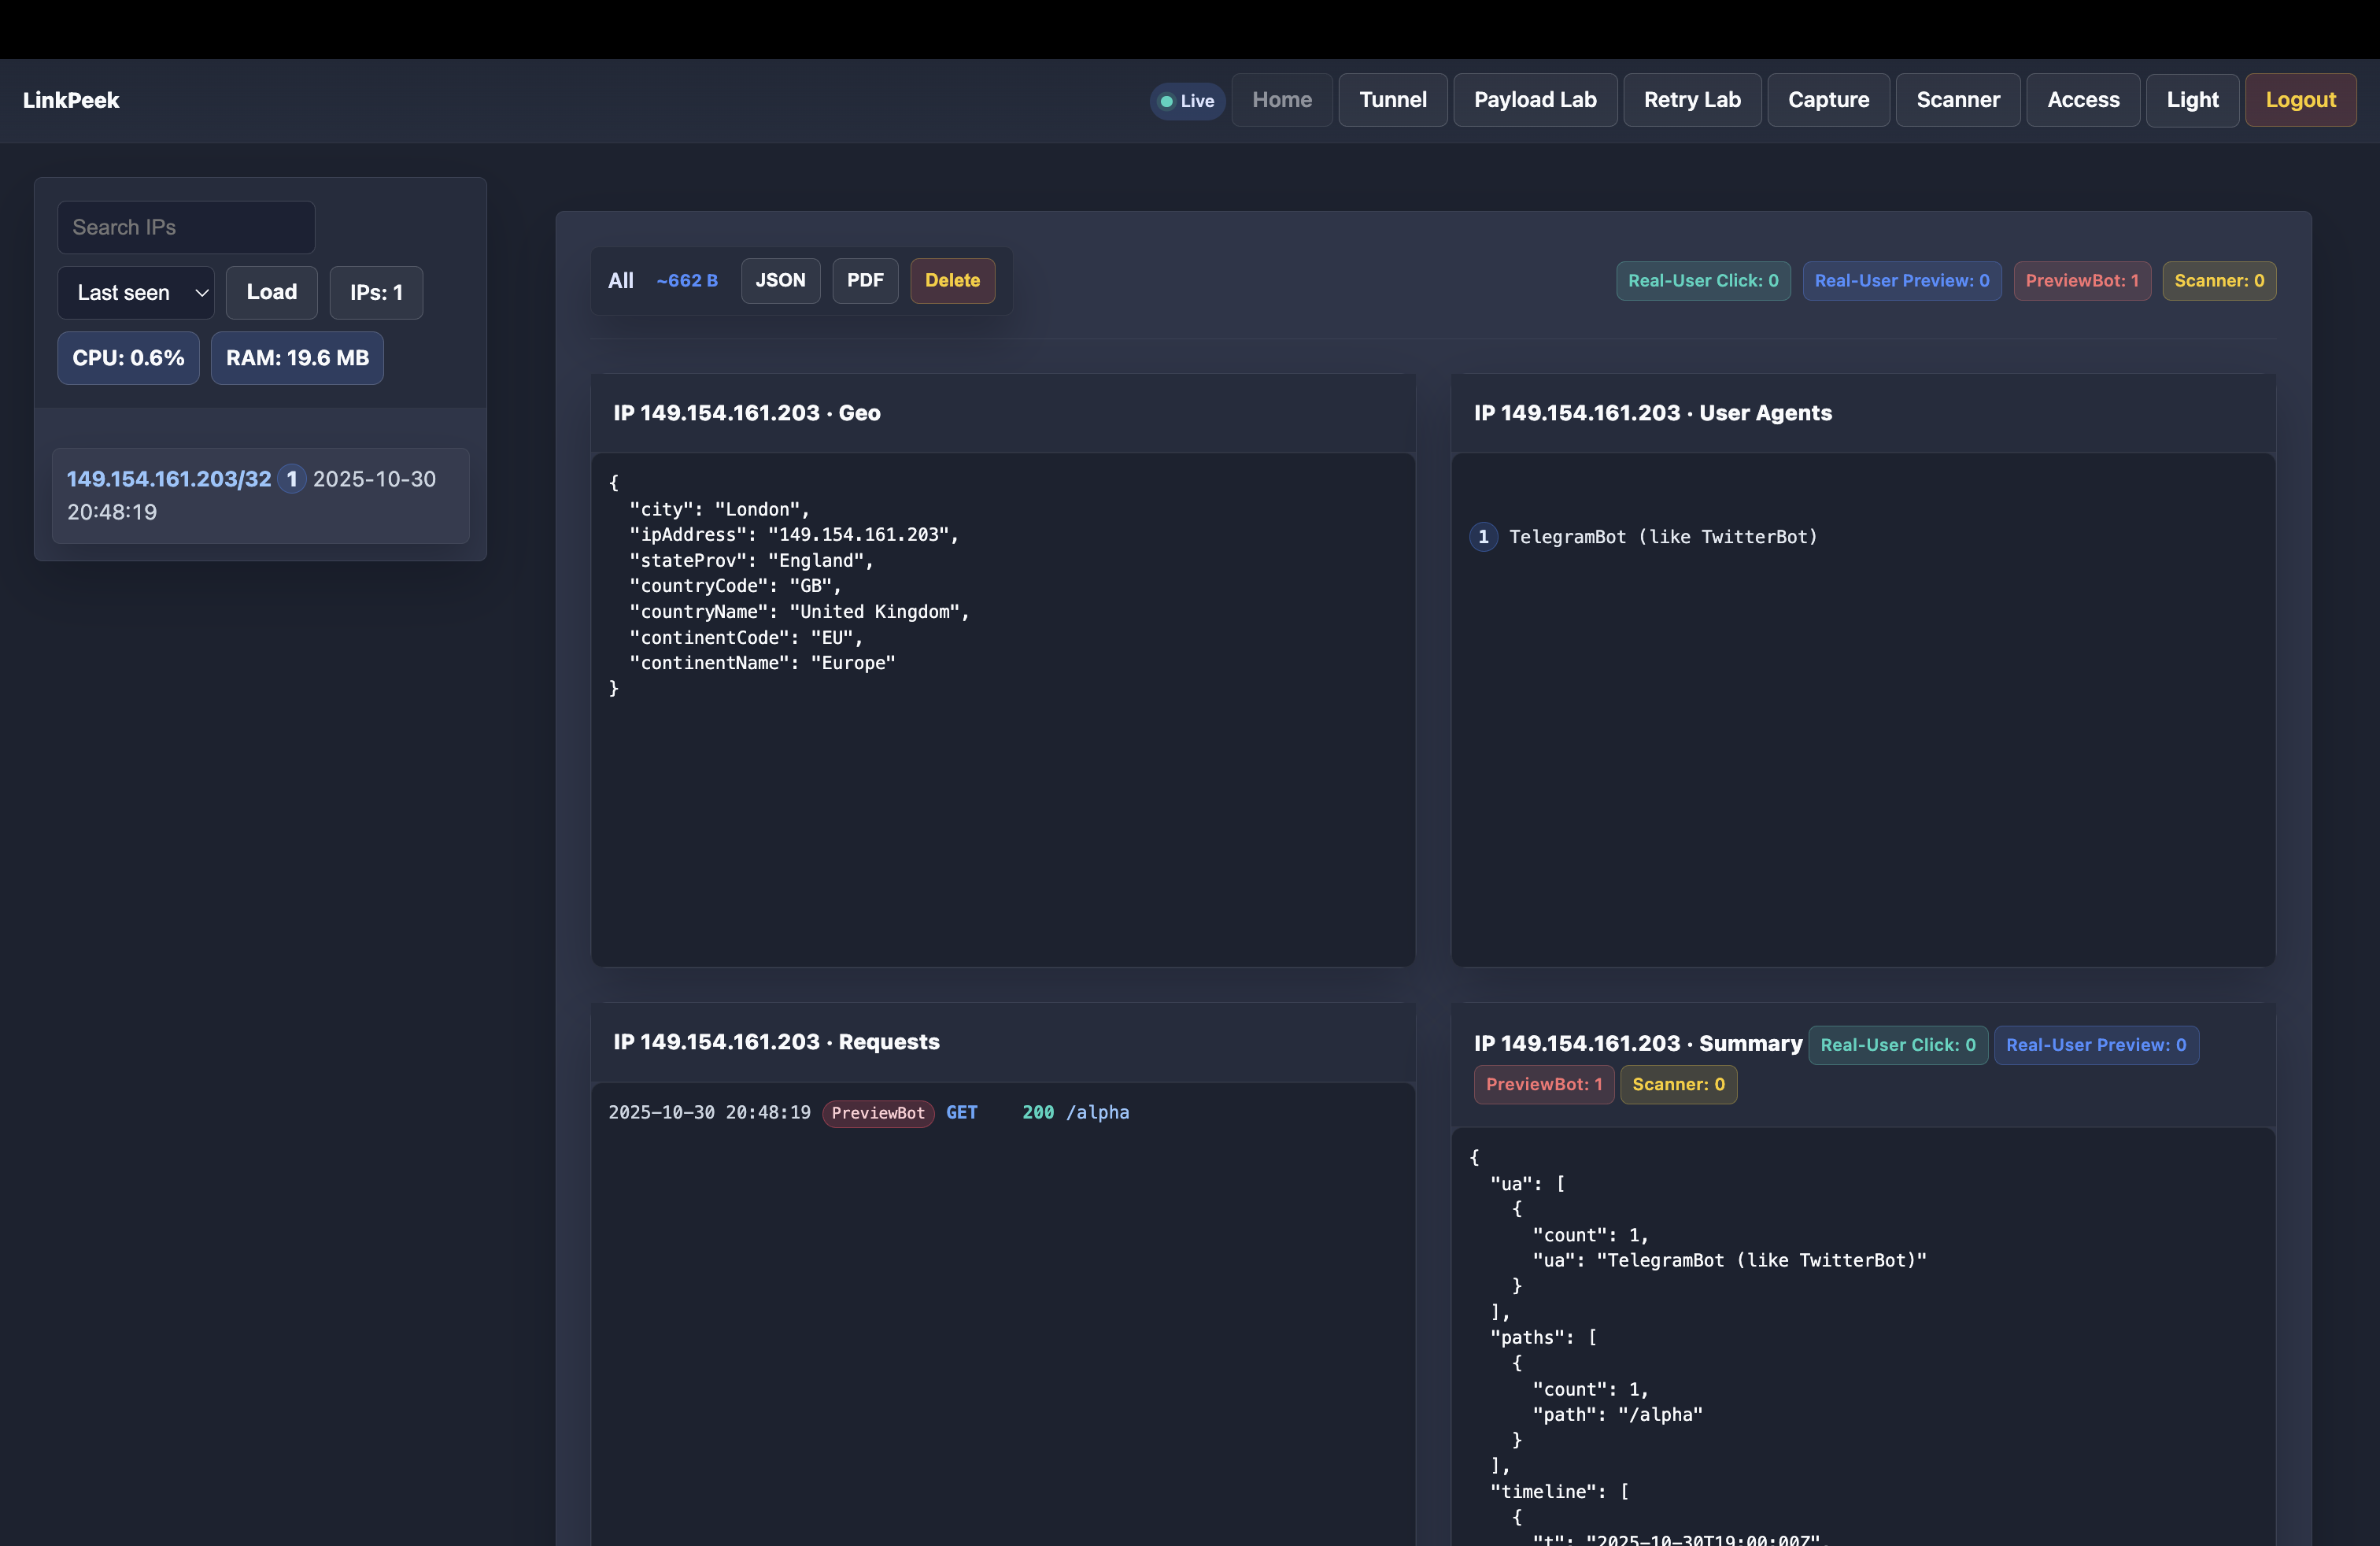
Hover the activity feed to inspect request metadata; badges call out real users versus preview bots and scanner jobs.
1. Health and authentication
Section titled “1. Health and authentication”- Visit
https://<host>:9009/and confirm the dashboard loads without TLS warnings. - Log in with the configured admin credential (the default is
adminif you did not setLINKPEEK_ADMIN_PASSWORD); expect an automatic session regeneration after success. - Open the Access panel and rotate the password to a team-shared secret, adding an audit note for future reference.
2. Capture lab sanity check
Section titled “2. Capture lab sanity check”- Create a new capture endpoint and copy the generated URL.
- Send a sample
curlrequest:Terminal window curl -X POST "<capture-url>" \-H 'Content-Type: application/json' \-d '{"hello":"capture"}' - Confirm the payload appears instantly in the capture log stream and that the export buttons activate.

Use the capture timeline to confirm your test request appears with full headers before proceeding to other labs.
3. Payload lab validation
Section titled “3. Payload lab validation”- Upload a small HTML payload via Payload → Upload.
- Enable “Attachment” and “Redirect” variants to generate new preview URLs.
- Use the in-app log tile to verify the payload lab recorded the mutations and that the export link works.
4. Retry scenarios
Section titled “4. Retry scenarios”- Open Retry Lab and trigger the
slow-startscenario. - Observe the progress bars update in realtime; call
GET /api/retrylab/statsto confirm the counters increment.
5. Scanner and tunnel checks
Section titled “5. Scanner and tunnel checks”- Schedule a single-run scanner job hitting
https://example.org, wait for completion, and review the response card for status, duration, and the captured snippet. - If you run the Cloudflare Quick Tunnel sidecar, view the Tunnel tile to confirm hostname discovery and restart controls respond.
6. API and websocket smoke test
Section titled “6. API and websocket smoke test”- Establish a WebSocket connection:
wss://<host>:9009/realtime?token=<session>and subscribe tolog.event. - Open multiple browser tabs; ensure activity broadcasts synchronize across sessions.
7. Export and backup
Section titled “7. Export and backup”- Download the home dashboard PDF export and verify the file contains the expected telemetry.
- Create or update a backup policy for
DATA_DIRand any Postgres volume in your infrastructure tooling.
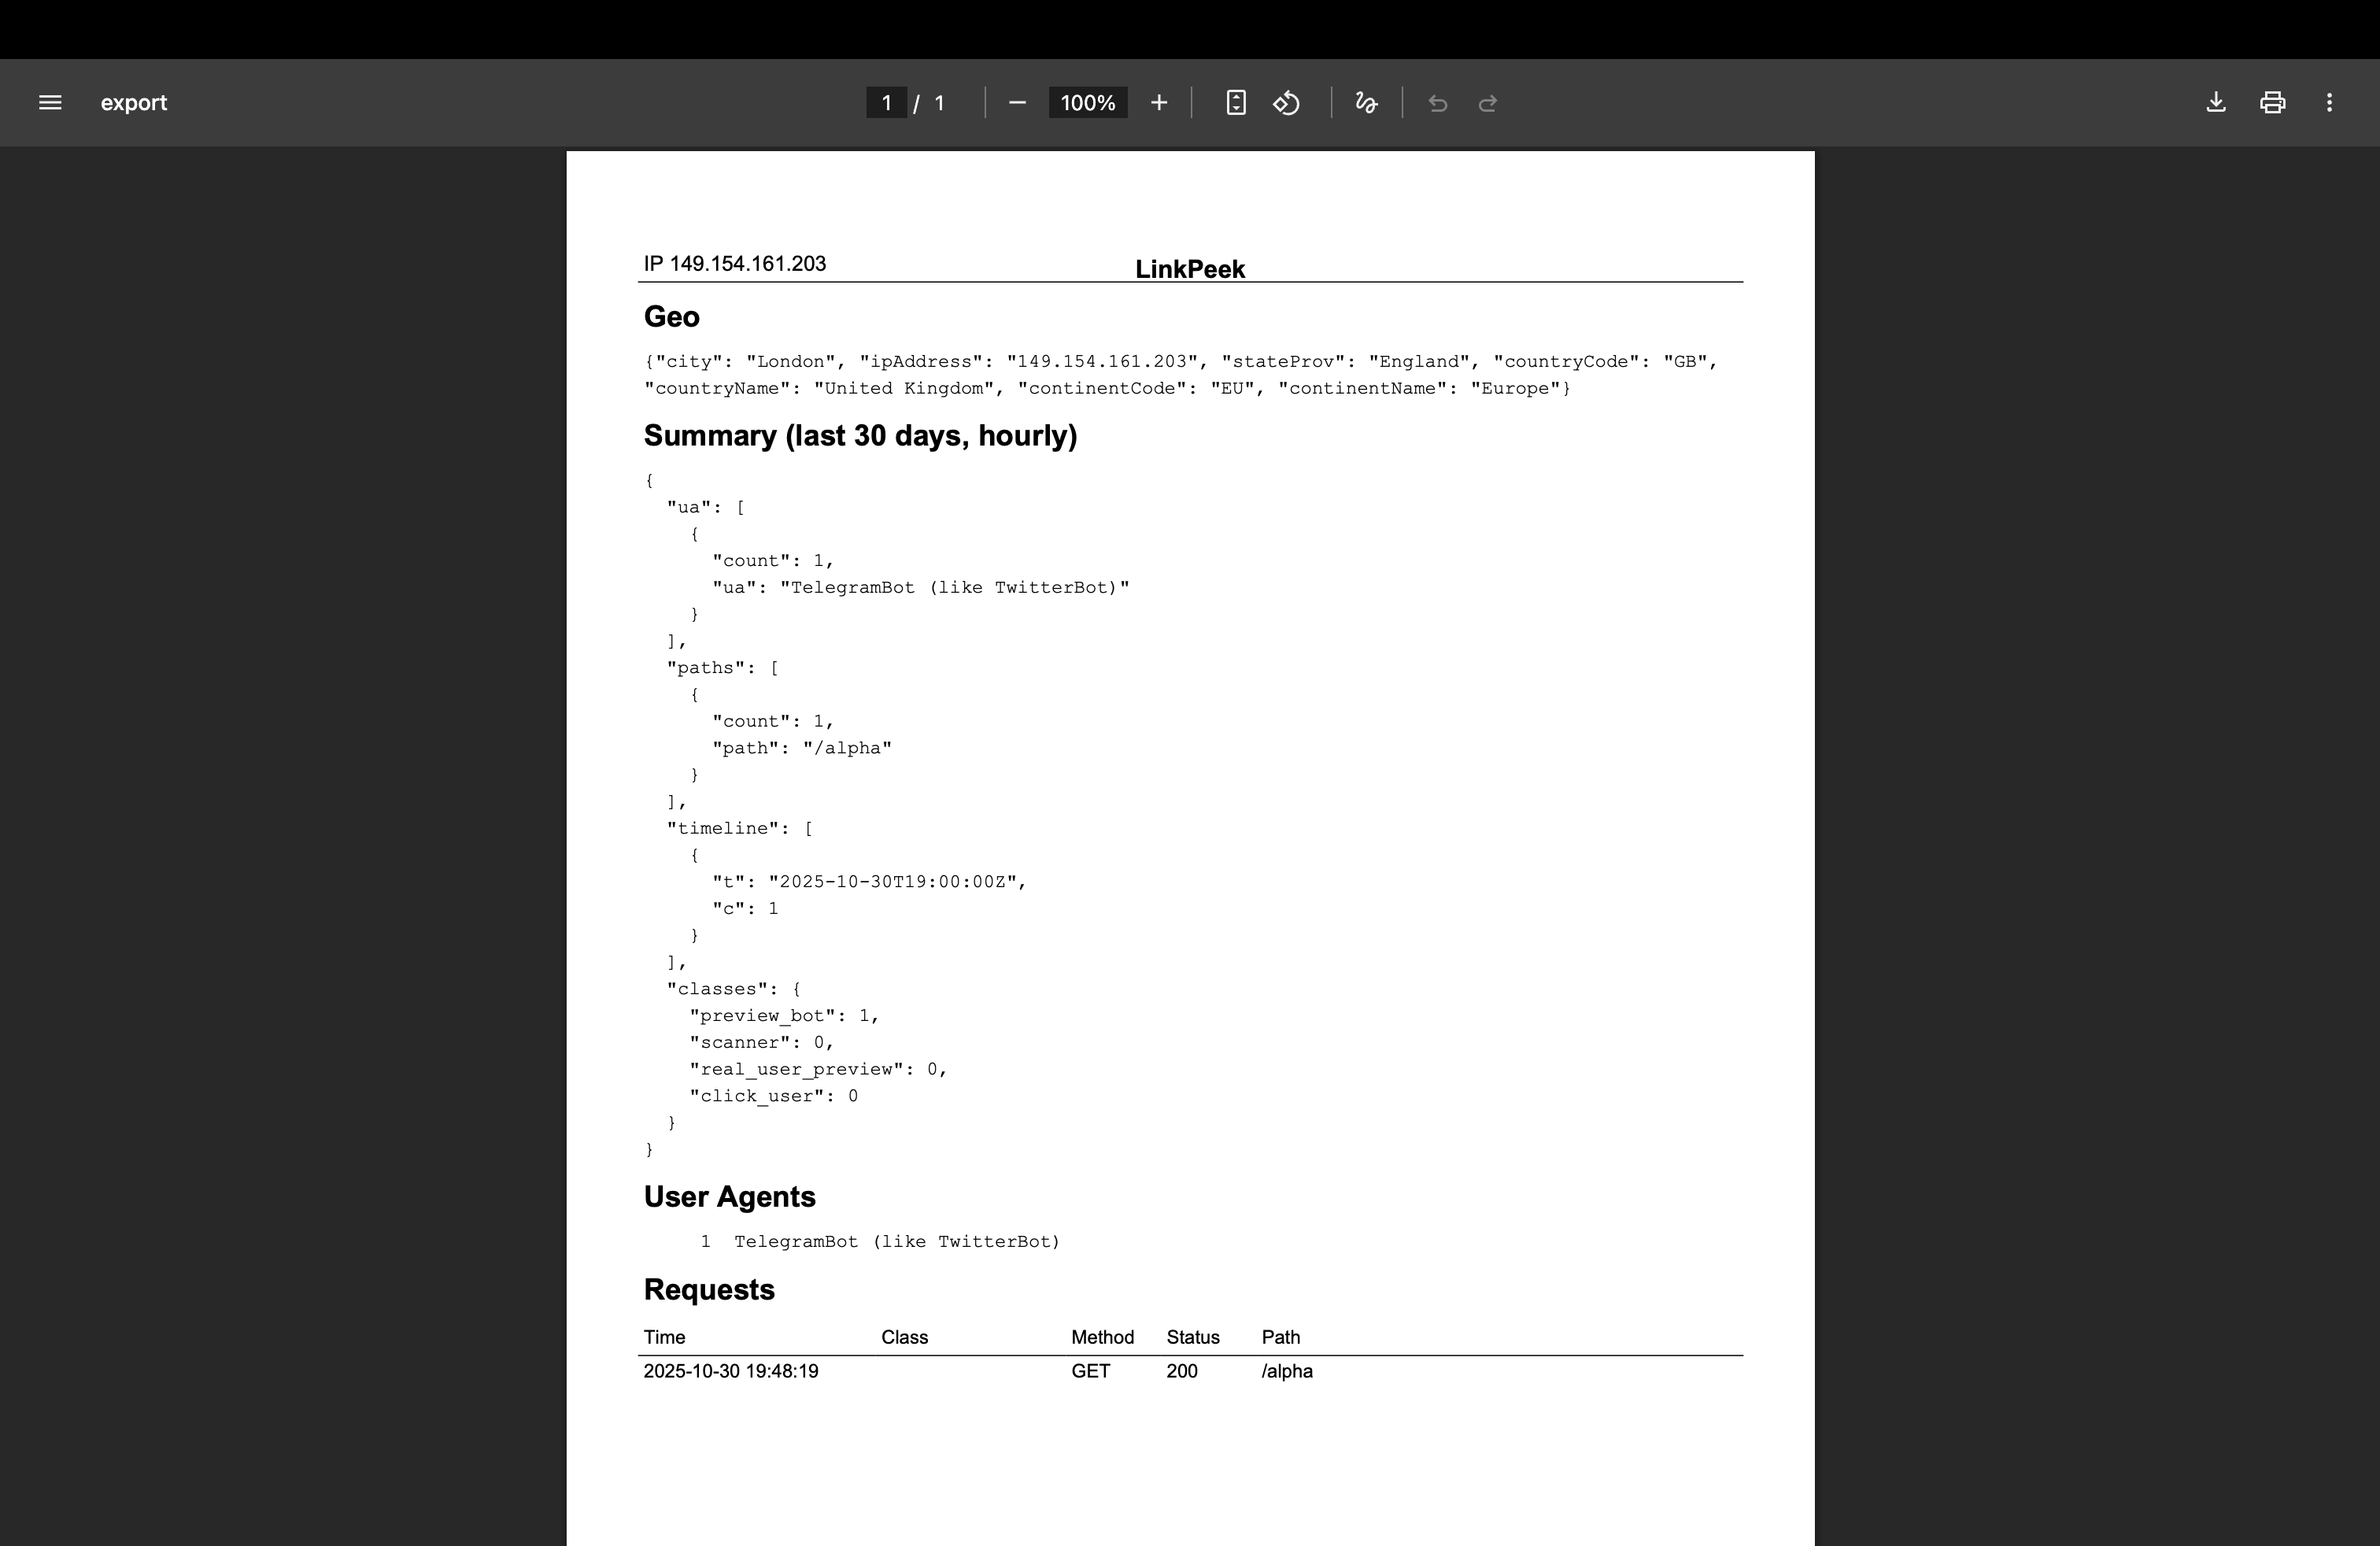
Use the PDF export to capture a timestamped snapshot of dashboard metrics and recent activity logs for incident records.
All green? Move on to the deployment options to tailor the stack for staging and production.